Cost and Count Reports
These are reports that let you know both the number of services you have and the cost associated with those services.
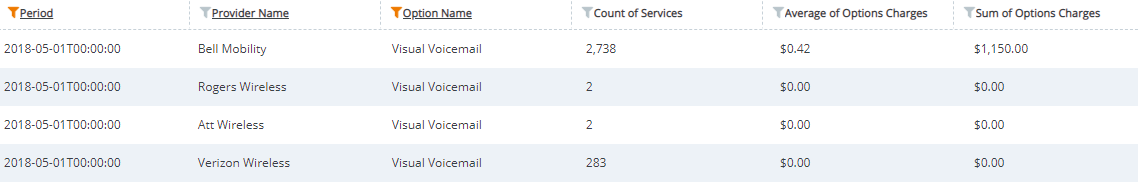
Description: Shows a summary of the count and of the cost of the options associated with inventory items. Generate this report to see by option name, how many services have that option, which providers have the option, as well as the costs by providers for that option. The "average" charges found in this report are based on the [charge/count of services].
Benefit: Helps you easily identify the breakdown of option costs by providers for better planning and budgeting. This report can be used to see what providers are charging you for a specific option, and how much you are spending on a particular option.
Roles: MACD, Administrator.
Fields to note:
- Provider name
- Option name
- Average of options charges
- Sum of options charges
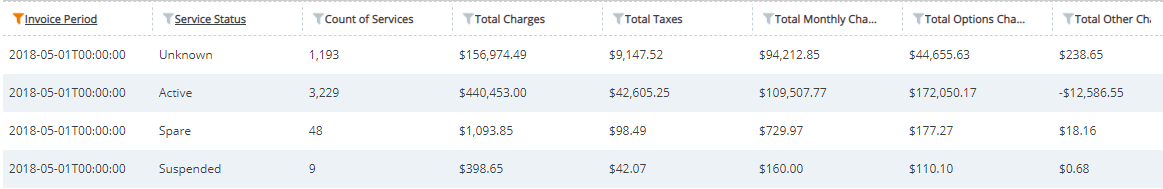
Description: Shows a summary of the statuses and of the cost of your services. This report will help you determine how many active (or spare or suspended) services you have. The report gives you a summary of all services by status for any point-in-time (month) selected. The "average" charges found in this report are based on the [charge/count of services].
Benefit: Helps you easily identify the count of services which have a specific status as well as the services’ associated cost per provider. This can help improve your planning and budgeting.
Roles: MACD, Administrator.
Fields to note:
- Service status
- Count of services
- Total & average charges
- Total & average taxes
- Total & average other charges and credits
- Total & average usage charges
- Total & average peak charges
- Total & average evening charges
- Total & average weekend charges
- Total & average minutes
- Total & average peak minutes
- Total & average evening minutes
- Total & average inter-company minutes
- Total & average text message count
- Total & average text message costs
- Total & average hardware rental charges
- Total & average hardware maintenance charges
- Total & average hardware management charges
- Total & average 411 calls
- Total & average 411 costs
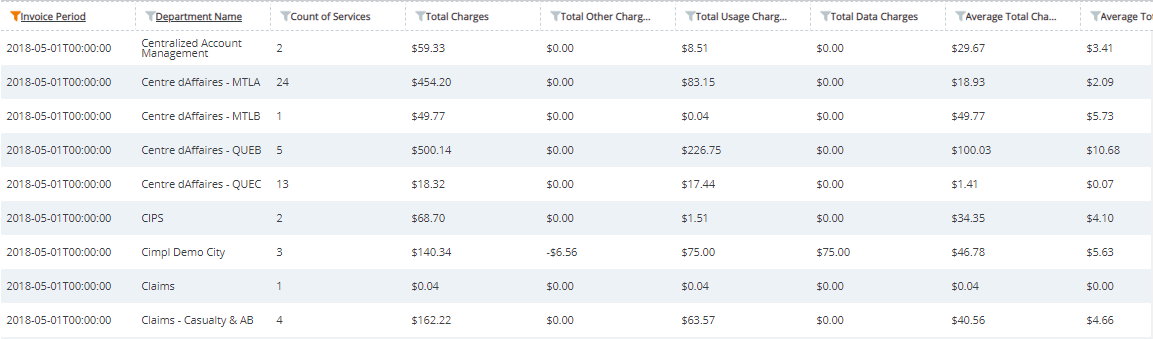
Description: Shows a summary of the count and of the cost of services belonging to departments (where "departments" are the lowest organizational unit that the employees work for directly). The "average" charges found in this report are based on the [charge/count of services].
Benefit: Helps you determine the breakdown of service costs by department for better planning and budgeting. See which organizational units have the most services, spend the most in a particular cost category, or get the organizational unit's average charges for a particular month.
Roles: MACD, Administrator.
Fields to note:
- Service status
- Count of services
- Total & average charges
- Total & average taxes
- Total & average other charges and credits
- Total & average usage charges
- Total & average peak charges
- Total & average evening charges
- Total & average weekend charges
- Total & average minutes
- Total & average peak minutes
- Total & average evening minutes
- Total & average inter-company minutes
- Total & average text message count
- Total & average text message costs
- Total & average hardware rental charges
- Total & average hardware maintenance charges
- Total & average hardware management charges
- Total & average 411 calls
- Total & average 411 costs
Description: Shows a summary of the count and of the cost of services associated with particular addresses.
Benefit: Helps you easily determine the number and cost of services assigned to specific addresses for better planning and budgeting. The Count Cost Services by Address report is great to use for wireline, IT Assets and other categories managed in Cimpl.
Roles: MACD, Administrator.
Fields to note:
- Address line 1
- Total charges
- All cost and usage related fields from invoice
- Service type
- Employee information
- Department information
- Division information
- Location name
- Location number
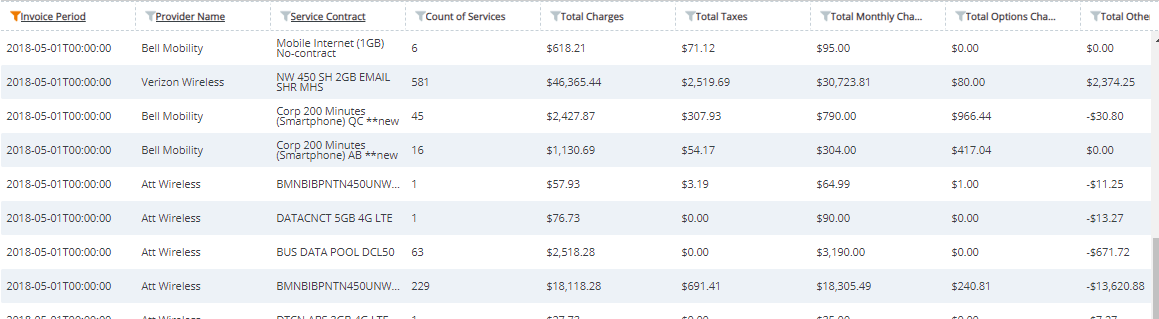
Description: Shows a summary of the count and of the cost of services associated with particular contract. The report shows you, by provider, the number of services in Cimpl that are assigned to each contract, as well as all financially related information: totals on costs and usage as well as the averages of costs and usage.
Benefit: Helps you determine the number and cost of services assigned to specific contracts for better planning and budgeting. Use this report to see what features are being used and charged per plan. The report provides visibility as to what is being used or not, and all related charges being incurred.
Roles: MACD, Administrator.
Fields to note:
- Provider name
- Service contract
- Count of services
- All charges from invoices by charge type (totals and averages)
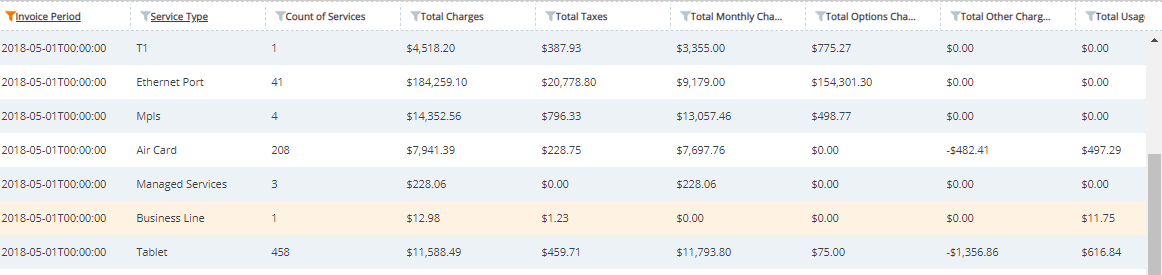
Description: Shows a summary of the count and of the cost of particular service types. The report gives you a full view of all service types, by provider, with their costs as well as the number of services with a particular service type associated for the invoice period selected. This report is what open from View Reports link on the MACD Dashboard in the Summary of Services widget when filtered by Service Type.
Benefit: Helps you easily determine the number and cost of specific service types for better planning and budgeting. Use this report to gather information on the count by service types as well as the costs by total cost, as well as by each type of cost and usage from the invoice. The report also displays averages for costs and usage.
Roles: MACD, Administrator.
Fields to note:
- Invoice period
- Service type
- Count of services
- All cost fields from the invoices (totals and averages)
- All usage fields from invoices (totals and averages)
Description: Shows a summary of the count and of the cost of services by provider. The report gives you a full view of all providers, with their costs as well as the number of services associated for the invoice period selected. This report is what opens from View Reports link on the MACD Dashboard in the Summary of Services widget when filtered by Provider.
Benefit: Helps you easily determine the number and cost of services broken down by provider for better planning and budgeting. This is a good report to use for an overall view of what you have and what you are spending by provider for a particular month.
Roles: MACD, Administrator.
Fields to note:
- Invoice period
- Provider name
- Count of services
- Total charges
- All other charge type and usage fields from the invoices by totals and averages
Description: Shows a summary of the count and of the cost of services by employee ratio.
Benefit: Helps you easily determine the number and cost of specific services by showing a ratio of costs to number of employees for better planning and budgeting.
Roles: MACD, Administrator.
Report Calculation: Each ratio value is calculated using the total charges from a provider's monthly invoice merged with the count of services in the organization's inventory, divided by the number of distinct employees who are assigned services.
When we refer to distinct employees, we mean that we count each employee only once, even if they are associated with multiple services or devices.
Example: We have three distinct employees in the "Employee Name" column (i.e., John, Jane, and Bob, even though John appears twice), and four distinct employees in the "Subscriber Name" column (i.e., John, Jane, Jim, and Bob).
| Service ID | Employee Name | Subscriber Name |
|---|---|---|
| 1234 | John | John |
| 1235 | John | John |
| 1236 | Jane | Jane |
| 1237 | Jim | |
| 1238 | Bob | Bob |
| 1239 |
The calculation of the ratio is based on the number of distinct employees found in the "Employee Name" category. However, if no name is found there, then Cimpl looks for a name from the "Subscriber Name" category, and uses counts the employee listed there in association with a given service as a data point in its calculations. When a service is associated with neither an employee nor a subscriber, Cimpl simply ignores that service's contribution to the calculation of the ratio.
Description: Shows a summary of the count and of the cost of services by minute ratio.
Benefit: Helps you easily determine the number and cost of specific services by showing a ratio of their costs to number of minutes for better planning and budgeting.
Roles: MACD, Administrator.